
- This event has passed.
📊 Python Data Visualization for Beginners
July 23, 2023 @ 3:30 pm - 5:30 pm
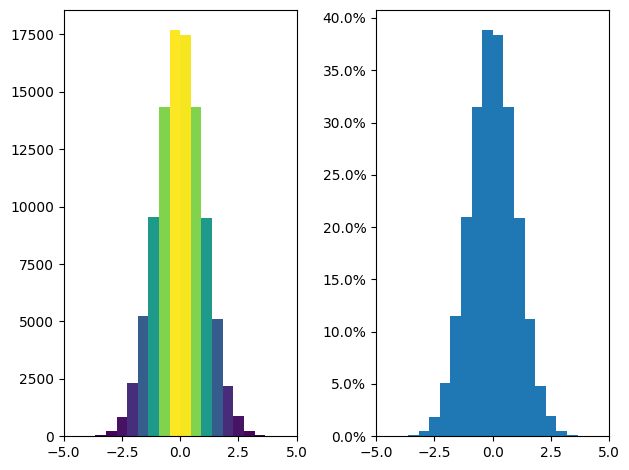
On Sunday, July 23rd at 3:30 p.m. we’re hosting a workshop on creating charts and graphs with the Python programming language. We’ll use the modules matplotlib and seaborn to create a range of common plots: histogram, pie chart, bar graph, line graph, and scatter plot. We’ll use Jupyter Notebook to keep our code organized.
This workshop is designed with beginners in mind, including people who don’t have programming experience. More experienced programmers are welcome too!
We’ll have a computer available for everyone who signs up.